



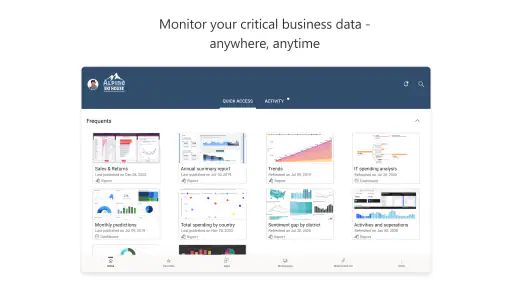
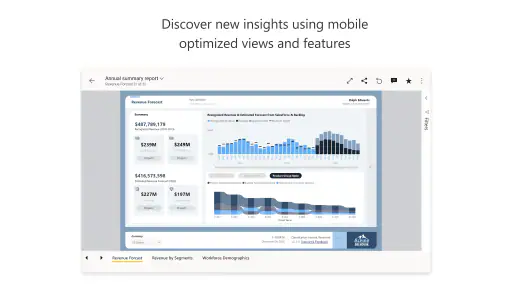
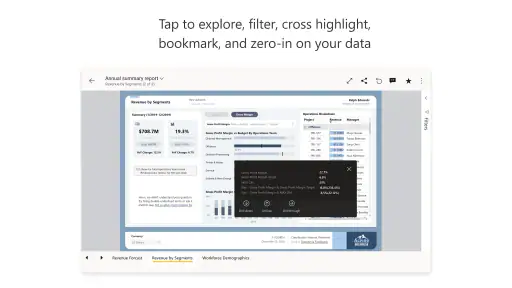
Microsoft Power BI is the kind of business app that can feel immediately useful and then quietly prove its value over time. I see it less as a place to build reports from scratch and more as a mobile window into the dashboards and reports that already matter to a team. That distinction is important: if you want to explore sales, operations, finance, or project information while away from a desk, it can become a dependable habit. If you expect a complete spreadsheet replacement or a full desktop authoring studio in your pocket, you may find it restrictive.
Developed by Microsoft Corporation, this free business app is available for Everyone and supports devices running Android or iOS 11 and later. It has been around since July 7, 2015, and its current version is 2.2.260811.21320514. Those details matter because this is not a novelty dashboard viewer with a narrow audience. It is a mature companion for people who need to keep an eye on business information without opening a laptop.
What feels useful during the first week
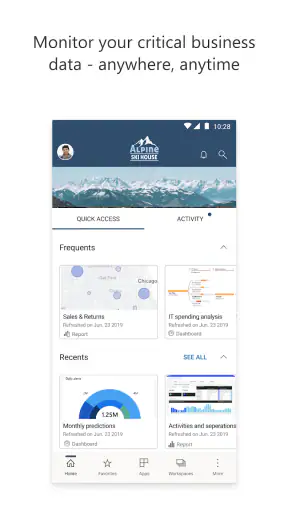
My first impression of Power BI is that its value depends on what has already been prepared for you. Once the relevant reports and dashboards are available, the app gives you a much faster route to the information you need than searching through email attachments or waiting until you return to your office computer. A manager can check current performance before a meeting, a salesperson can review account information between appointments, and an operations lead can look for an unusual change while moving around a site.
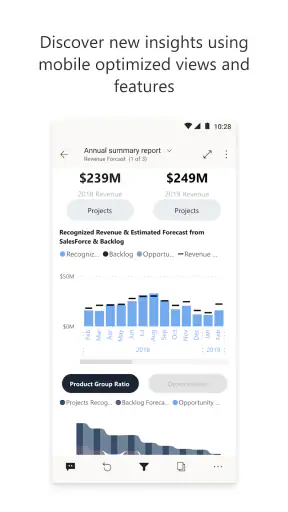
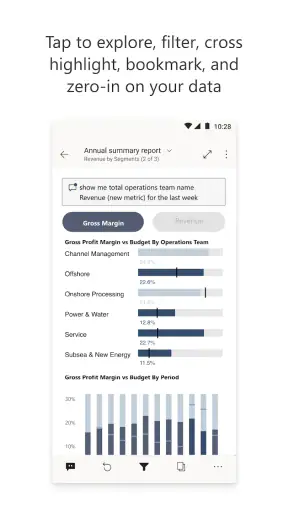
The strongest early experience is not the number of charts on screen. It is the ability to move from a broad overview toward a more specific question. A dashboard may show a general result, while a report lets you inspect the categories, periods, or business areas behind it. I found that this makes the app more useful when I already know what decision I am trying to support. “Are we behind?” is a good starting question; “Which region, product group, or period explains the change?” is where the report becomes genuinely helpful.
That also explains why the app can feel less impressive to a personal user. Power BI is built around shared business reporting rather than casual personal tracking. It does not become valuable simply because it is installed. Someone has to create, organize, and maintain the reports, and the information must be relevant to the person viewing it. Without that preparation, the app is mostly an empty doorway.
The mobile format works especially well for short checks. I would use it before a conversation with a customer, during a commute, or just before a team update. I would not choose a phone screen for deep analysis lasting an hour. Small charts can be harder to compare, labels may require careful inspection, and moving between several report pages is naturally slower than working on a large monitor.
A realistic example is a regional manager preparing for a morning meeting. Instead of opening several spreadsheets, the manager can review the latest dashboard, notice that one territory is behaving differently, and open the related report for context. That does not replace the meeting or the underlying analysis, but it changes the quality of preparation. The manager arrives with a focused question rather than a vague feeling that something needs attention.
One useful habit is to decide which reports deserve regular attention before spending time exploring everything available. A crowded workspace can make the app feel confusing, particularly when several dashboards have similar names. Marking or organizing the reports that support recurring decisions helps turn Power BI from a browsing tool into a practical morning or weekly check-in.
What the mobile experience does better than email
Compared with receiving static spreadsheet files or screenshots, Power BI has a clear advantage: the report remains a place to investigate rather than a document that becomes outdated as soon as it is sent. When the underlying reporting process is maintained properly, I can return to the same view and see the current picture instead of wondering which attachment is the latest one.
The trade-off is that a mobile report can expose complexity without giving you the full context of the person who built it. A chart may be accurate yet still require knowledge of the business definitions behind it. Before relying on a figure in a serious conversation, I would check its title, filters, date range, and surrounding notes. The app makes access convenient, but convenience should not be confused with automatic understanding.
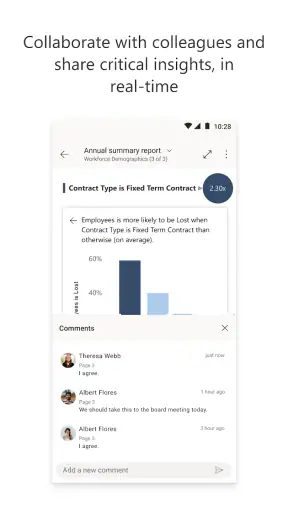
Another early strength is the way it supports conversations. When someone asks why a result changed, I can use the report to narrow the question instead of promising to investigate later. That is a subtle benefit: the app is often most valuable when it shortens the distance between noticing an issue and asking a better follow-up question.
Why it can earn a place month after month
The lasting value of Power BI comes from repeated decisions, not occasional curiosity. If the same information helps me decide where to spend time, which team needs support, or whether a target is moving in the right direction, opening the app becomes part of my routine. The best long-term use is therefore tied to a clear business rhythm: a daily operational check, a weekly review, or preparation for a recurring meeting.
I would judge the app by asking whether it removes a repeated inconvenience. If I regularly need to ask a colleague for the latest numbers, search through shared files, or wait for a desktop report to load, a mobile dashboard can save meaningful effort. If my work rarely involves changing business information, the app may not become a lasting habit no matter how polished the interface feels.
There is also a useful distinction between monitoring and investigating. Power BI is strong as a monitoring companion because a quick glance can tell me whether something deserves attention. Investigation is more demanding. Once I need to compare several possibilities, document a detailed explanation, or build a new analytical view, a desktop workflow is usually more comfortable. I would keep the mobile app for awareness and use a larger screen for the work that follows.
The app’s audience is reflected in its reputation: it holds a 4.5 average from around 75 thousand ratings, with roughly 1.3 thousand written reviews, and has passed 5 million installs. I do not treat those figures as proof that it suits everyone, but they do suggest that the mobile companion has found a substantial audience among people who already rely on business intelligence workflows.
For a small business owner, the decision is more nuanced. If the business already uses Microsoft reporting tools and someone is responsible for keeping the dashboards accurate, Power BI can make the information easier to reach. If the owner is looking for a simple sales tracker that requires almost no setup, a dedicated small-business finance or inventory app may be easier to maintain. Power BI becomes worthwhile when the questions are broader than one simple list or ledger.
For team members, the app can reduce dependence on a single analyst. That does not mean every employee should receive every report. A carefully selected set of views is more useful than a large library that nobody understands. I would ask the report owner to make the purpose of each dashboard obvious and to remove old or duplicate views where possible. Good organization is not cosmetic here; it determines whether the app becomes part of a routine or gets ignored.
Three practical habits that improve its long-term usefulness
First, I would connect each regularly viewed report to a decision. Instead of opening a dashboard simply because it is available, I would define what action follows a meaningful change. For example, a sudden shift might prompt a conversation with a regional lead, a review of a campaign, or a check of the underlying records. This keeps the app from becoming passive chart-watching.
Second, I would use the mobile view as a triage layer. Start with the overview, identify the one or two areas that look unusual, and save deeper investigation for a desktop session when needed. This approach respects the strengths of a phone while avoiding the frustration of trying to perform every analytical task on a small screen.
Third, I would periodically question whether the reports still match the team’s decisions. A dashboard can remain technically available long after its original purpose has faded. The app cannot solve that maintenance problem by itself. A short review of report names, filters, owners, and business definitions can make the same mobile experience far more useful without adding another tool.
These habits are more important than novelty. A new dashboard may be interesting for a day, but recurring value comes from trustworthy information presented at the moment a decision is being made. That is where Power BI has a reasonable chance of earning permanent space on a phone.
Maintenance, friction, and the reasons people stop opening it
The main maintenance burden sits behind the app rather than inside it. Reports need current sources, sensible definitions, and someone willing to notice when a metric no longer reflects how the business operates. If a report is poorly maintained, the mobile experience can make stale or confusing information easier to access, not more reliable. I would never judge a dashboard only by how attractive its charts look.
Users should also expect a learning curve around filters and report structure. A casual viewer may understand a headline figure but miss that a page is filtered to a particular period, department, or category. This is one reason I prefer reports with clear labels and a small number of purposeful controls. More options are not automatically more useful, especially when someone is checking information quickly on a phone.
Another source of fatigue is notification overload, when alerts or updates are configured without a clear purpose. I would keep only the signals that can lead to an action. If every minor movement competes for attention, the important change becomes harder to notice. The app works best when it supports a calm review routine rather than turning every fluctuation into an urgent event.
There can also be a social maintenance problem. A report may be technically correct but not trusted by the people expected to use it. If different teams use different definitions for the same term, the dashboard becomes a source of debate instead of clarity. In that situation, the solution is not simply installing the mobile app. The organization needs to agree on what the measures mean and who is responsible for them.
Privacy and access deserve practical attention as well. A business dashboard can contain information that should not be casually displayed in a public place. I would be careful when reviewing sensitive figures on public transport, in a customer meeting, or while sharing my screen. The fact that an app makes information portable does not make every location appropriate for viewing it.
The most common fatigue pattern is opening the app repeatedly without finding anything that changes a decision. If the reports are static, overly broad, or disconnected from someone’s responsibilities, the habit will fade. That is not necessarily a failure of the software; it may indicate that the reporting setup needs fewer views, better ownership, or more relevant measures.
There is also a limit to how much context a mobile interface can provide. A chart can show that a number moved, but it may not explain whether the cause was a data delay, a one-off event, a change in reporting rules, or a genuine business trend. I would treat the mobile result as a prompt for judgment, not as a substitute for understanding the process behind it.
Who should use it and who should choose something else
I recommend Power BI to managers, analysts, sales teams, operations staff, and business owners who already have meaningful reports available and need quick access away from a desk. It is particularly suitable for people who make repeated decisions from shared information and want a consistent place to check progress.
I would be more cautious recommending it to someone who wants to build a personal budget, manage a simple task list, or track a small amount of information without a reporting setup. A spreadsheet can be more flexible for one-off calculations, while a focused finance or project app may be faster for a narrow personal workflow. Power BI earns its place when the reporting environment is already part of the work, not merely because it is a well-known name.
It is also not my first choice for detailed data preparation or report design on a phone. A desktop tool gives more room for arranging visuals, checking relationships, and understanding the full structure of a report. The mobile app is best viewed as the access point that keeps important information close, not as the entire business intelligence process.
For teams comparing it with ordinary spreadsheets, the trade-off is consistency versus flexibility. A shared report can reduce the problem of multiple versions circulating by email, while a spreadsheet is often quicker for an individual to modify. For teams comparing it with a basic dashboard service, Power BI may make more sense when their existing work already sits within Microsoft’s business ecosystem. If they need only a handful of simple charts and have no appetite for report ownership, a lighter tool may involve less ongoing effort.
My long-term verdict
After the initial appeal fades, Microsoft Power BI remains useful when three things stay true: the reports are trusted, the information supports recurring decisions, and someone maintains the reporting environment. Under those conditions, I can see myself keeping it installed for the quiet convenience of checking the business picture before a meeting or while away from my desk.
Its limitations are equally clear. It is not a magic source of insight, it is not the easiest place for deep analysis, and it cannot rescue reports that are poorly organized or outdated. The mobile screen encourages quick judgments, so I would pair it with careful attention to filters, definitions, and context. That discipline is part of using the app responsibly.
The fact that it is free removes an obvious barrier for people who already have a compatible reporting setup, and its Everyone age rating makes it broadly approachable. Still, the real cost is measured in setup and maintenance time. A business that cannot assign ownership to its reports may gain little from adding another viewing surface.
My final recommendation is straightforward: install it if your work already depends on Power BI reports and you often need answers while moving between meetings, customers, or locations. Give it a defined role, keep the report collection focused, and use the phone for monitoring rather than forcing it to replace desktop analysis. Its lasting value comes from turning reliable shared reporting into a repeatable habit, not from simply putting more charts on a screen.
With that expectation, this Microsoft business app is a practical companion rather than a complete analytics workstation. I would keep it on my device when it shortens the route from a question to a useful conversation. If it does not connect to a real recurring decision, I would skip it in favor of a simpler tool that demands less maintenance.


